Part ofData Studies·Original research on how Indian businesses show up online — sample sizes, methods, and findings published in full.
Summary: We checked the public web presence of every solar installer named in the two vendor-list documents published on Tamil Nadu's Unified Solar Rooftop Portal: 333 unique companies. Just over half of them, 53%, have no website a customer can find. Of the sites that do exist, 98% load slower than the 2.5-second mark Google treats as good, and two-thirds of all vendors list a free Gmail or Yahoo address as their official contact on a government document.
This matters because vendor selection is a documented sticking point in India's rooftop solar rollout. CEEW's June 2026 survey of 17,094 households found that 57% of people who start a rooftop solar application run into process friction, and its recommendation is to steer households toward the empanelled vendor list at the selection stage. We looked at what a household actually finds when it gets there.
Key findings
- 53% of the 333 vendors have no findable website (176 of 333). Every vendor was checked individually, so this is a count rather than an estimate.
- 66% list a free email address as their official contact (201 on Gmail, 11 on Yahoo, 3 on Outlook, 4 on other free providers) rather than an address at their own domain.
- Median mobile load time (Largest Contentful Paint) was 10.6 seconds across the 86 live sites we could measure. Lighthouse scores mobile LCP against a 2.5-second good mark and a 4-second poor mark.
- 98% of measured sites came in over 2.5 seconds, and 85% over 4 seconds. 52% took more than ten seconds.
- 88% of these sites get too little traffic for Google to hold real-user performance data on them at all.
- 20% of live sites offer no contact form, no click-to-call link and no WhatsApp link. A visitor ready to buy has no one-tap way to make contact.
- 21% of vendors who own a domain have let it go dead or park on a placeholder, paying for a web address that shows customers nothing.
- The slowest site took 78 seconds to render its main content. The heaviest single page weighed 53.9 MB.
Why we ran this study
CEEW's 17,094-household survey (June 2026) is clear that rooftop solar spreads mainly through people, not web pages: peers and mass media dominate awareness, 69% of households prefer an in-person visit, and only 16–40% cite institutional sources such as government portals or DISCOM material. So we are not claiming that most solar buyers begin with a Google search.
Need Help With Your Project?
Tell us what you're building — we'll send a detailed proposal with timeline and cost breakdown within 24 hours.
What CEEW also found is that vendor selection is where willing households stall, and its policy recommendation is to push them toward the empanelled vendor list. That list is therefore about to carry more weight, not less. Nobody, as far as we could find, has measured the supply side of it: whether the vendors on those lists can be checked out online at all by a household that has been handed their names.
That is the gap this study fills. CEEW measured the consumer side; we measured the installers.
"The vendors on these lists aren't short of demand, they're short of a shop window. Until a household can check an installer online before letting them on the roof, the empanelment list is doing only half its job."
Ashok Kumar, founder of Redpulse Software and lead author of the study
What we measured, and how
The sample, described precisely
Tamil Nadu's Unified Solar Rooftop Portal (tnebltd.gov.in/usrp/) publishes two vendor-list documents. We took both in full:
- A 316-name list dated 18 April 2024. Its embedded PDF title is "National Portal for Rooftop Solar - Ministry of New and Renewable Energy.xlsx". It is MNRE's national-portal registered-vendor list for Tamil Nadu, republished on the state portal. It is the only vendor list currently linked from the portal's home page, and it has been byte-identical since May 2024.
- A 44-name list created 28 October 2022, authored by TNEB, a state empanelment under MNRE's Rooftop Solar Programme Phase-II. It predates PM Surya Ghar by about 16 months, and the agency that finalised it (TEDA) has since been merged into TNGECL.
Together that is 360 records. After removing duplicates (keyed on email address first, then on business domain, because the same company appears under different name renderings across the two lists), we were left with 333 unique vendors. We audited all of them. We did not select from the lists, and we did not sample: every vendor in both documents was checked.
Two honest labels on that sample. First, these are "vendors named in the documents the Tamil Nadu portal publishes", not a live register. The national portal's Tamil Nadu vendor list is updated continuously and is certainly larger today. Second, the process a household actually follows has two layers: applicants register and choose a vendor on the national portal (which carries vendor ratings), then apply through the state portal using that reference number and pick from the empanelled list shown there. Both layers apply; neither list on its own is the whole picture.
Need Help With Your Project?
Tell us what you're building — we'll send a detailed proposal with timeline and cost breakdown within 24 hours.
The checks
All checks were passive: the same requests any ordinary browser makes when a person visits a page. No security scanning, no login attempts, nothing beyond what a server volunteers in a normal response.
| Check | Method |
|---|---|
| Does a website exist | For vendors whose listed email uses their own domain: a direct request to that domain. For vendors listing only a free email: a search for the company name plus city, matching any result to a domain the company plausibly owns (directories, marketplaces and social profiles excluded). |
| HTTPS and certificate | TLS handshake; certificate trust and expiry |
| Speed, page weight, mobile usability | Google PageSpeed Insights API, mobile strategy, Lighthouse 13.4.1, requesting the performance, best-practices, accessibility and SEO categories |
| Contact paths | Presence of a form, a tel: link, and a WhatsApp click-to-chat link |
| Basic SEO | Presence of a title tag, meta description and H1 heading |
How to read the speed numbers
PageSpeed Insights' mobile strategy applies a deliberately pessimistic profile: simulated throttling at roughly 1.6 Mbps down with 150 ms latency, a 4× CPU slowdown, emulating a Moto G Power (2022). That is a slower-than-median connection and a low-end handset at the same time, so the absolute seconds are not what a typical urban user on good 4G experiences. They are a fair approximation of a modest Android phone on a weak connection, which is a realistic scenario in semi-urban and rural Tamil Nadu. Because every site was measured on the identical profile, the distribution and the ranking are the valid outputs.
One further caveat on thresholds: Google's 2.5-second and 4-second marks are formally defined against real-user field data at the 75th percentile, not against single lab runs. We compare to them because Lighthouse itself scores mobile LCP using those exact same values. The "over 10 seconds" band in our distribution is our own subdivision. Google's categories are only good, needs improvement, and poor.
Limitations, stated plainly
- Both groups were checked in full. The 113 vendors with a business-domain email (112 unique domains, since two share one) had that domain requested directly. All 219 vendors listing only a free email address were searched individually. Because this is a census rather than a sample, the 53% figure carries no sampling error.
- A vendor could own a site that does not rank for its own company name. Our method would miss it, and so would a customer searching for them — which is why the finding is stated as no findable website rather than no website. We have since measured how often this happens. For every vendor marked as having no findable website, we tried the domains their email address and company name imply (for example
amirthamrenewables.comfor a vendor writing fromamirthamrenewables@gmail.com) and checked whether the resulting page was live and demonstrably theirs. At least 12 of the 176 are: six print that same Gmail address on the site, three carry the registered company name as the page title. In none of those cases did the site appear anywhere in the first ten results for the company's own name — Facebook, IndiaMART, Justdial and company-registry pages did instead. So 53% is the share with no findable website; the share with no website at all is lower, and on this evidence at most 49%. - Speed figures are lab measurements. Field data does not exist for 88% of these sites because they receive too little traffic, so lab data is the only comparable basis available.
- We requested each vendor's homepage only, and did not execute JavaScript. A contact form or WhatsApp button that exists only on an interior page, or that is injected by a script after load, would not be counted. The contact-path figures are therefore a floor, not a ceiling.
- A domain that answers with a parking page, a hosting default page or an error page is counted as having no website. Twelve domains in this sample are parked, and nine do not resolve at all.
- City-level groups are small; several have only three or four measured sites. We publish them because the pattern is consistent, not because three sites characterise a district.
- Audits were run on 29 July 2026. One listed vendor is headquartered in Bengaluru; one lists no email at all.
Finding 1: about half cannot be found
Our audit checked all 112 domains belonging to vendors whose listed email uses their own domain. Only 88 of them (79%) serve a real, working website. Of the other 24: nine do not resolve at all, five answer with a 404 or 403, and ten answer normally but show a parking page, a hosting default page or an empty placeholder. That is 21% of domain-owning vendors paying for a web address that shows customers nothing. Four of the parked domains return a byte-identical GoDaddy holding page.
The larger group is the 219 vendors (66% of the sample) who list a Gmail, Yahoo, Outlook or similar address. We searched for every one of them: 69 have a website we could find and verify as live, and 150 do not. Adding the two groups together, 176 of the 333 vendors, 53%, have no findable website.
Finding 2: the Gmail signal
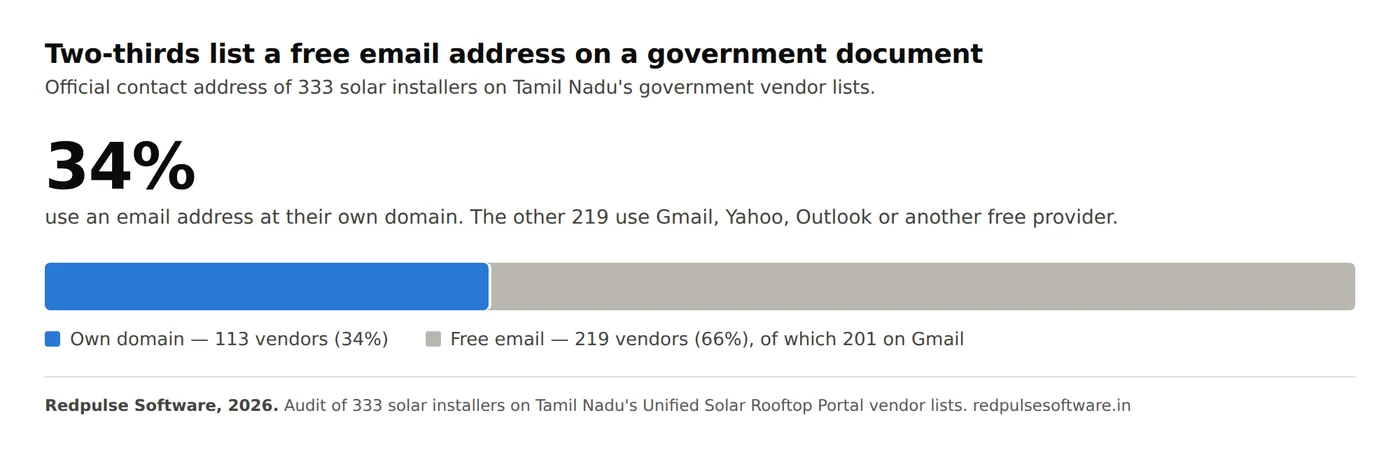
Our audit found that 201 of the 333 vendors, 60% of the entire list, gave a @gmail.com address as their official contact on a government document. A further 11 use Yahoo, 3 use Outlook and 4 use other free providers, so 219 vendors in total (66%) have no email at their own domain. Only 113 vendors, 34% of the list, use a business-domain address.
That matters more than it looks. For a household about to spend roughly ₹1.5–2.4 lakh at prevailing market prices before subsidy on a 2–3 kW rooftop system (about ₹0.7–1.4 lakh after the PM Surya Ghar subsidy, which pays ₹30,000 per kW for the first 2 kW plus ₹18,000 for the third, capped at ₹78,000), the difference between sales@company.in and company2019@gmail.com is one of the few permanence signals available before money changes hands. A domain costs a few hundred rupees a year and outlives any individual employee's inbox. Two-thirds of the installers on a government list for a ₹75,021 crore national scheme have not bought one, and a fifth of those who did have stopped pointing it at anything.
Finding 3: the sites that exist are slow
We measured 86 of the 88 live sites with Google's PageSpeed Insights API. Our measurements put the median Largest Contentful Paint on mobile at 10.6 seconds.
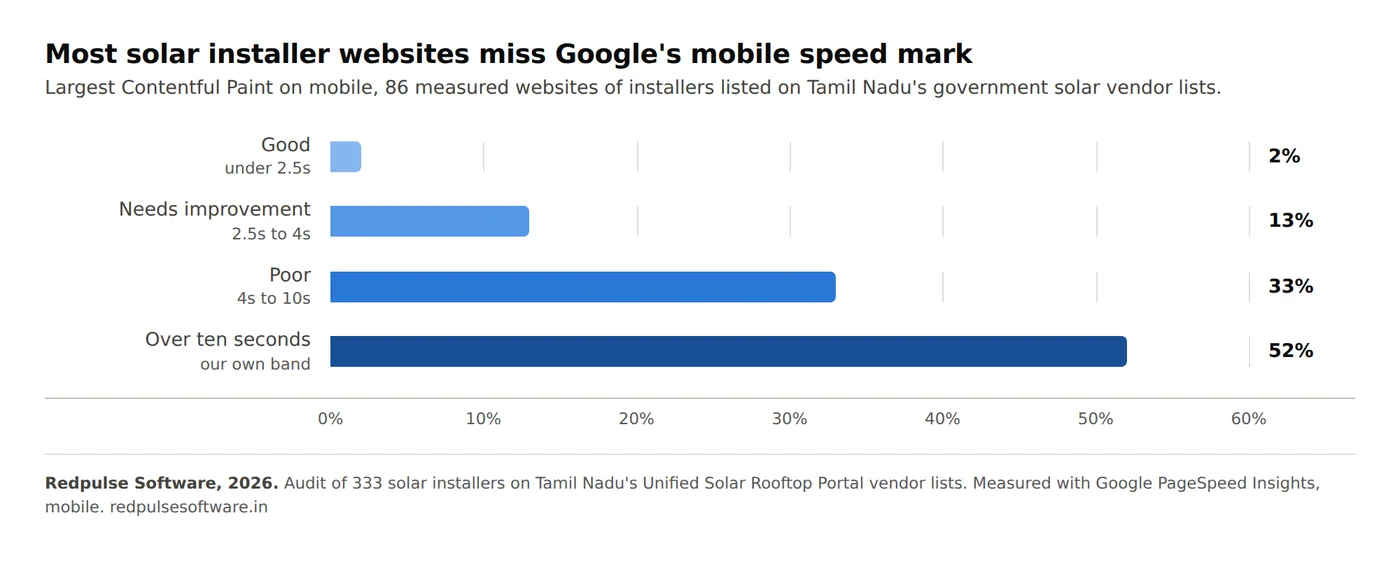
| Mobile LCP | Share of measured sites |
|---|---|
| Under 2.5s (good) | 2% |
| 2.5s to 4s (needs improvement) | 13% |
| 4s to 10s (poor) | 33% |
| Over 10s (our own subdivision of "poor") | 52% |
The cause is mostly weight. The median page transferred 3.72 MB, and one reached 53.9 MB, almost entirely uncompressed photographs. The median Lighthouse performance score was 59 out of 100.
The slowest result looked like a script error, so we measured it again. It wasn't an error: two runs four minutes apart returned 78.0 and 76.8 seconds for the same installer's homepage.
By city
Cities with at least three measured sites, fastest first:
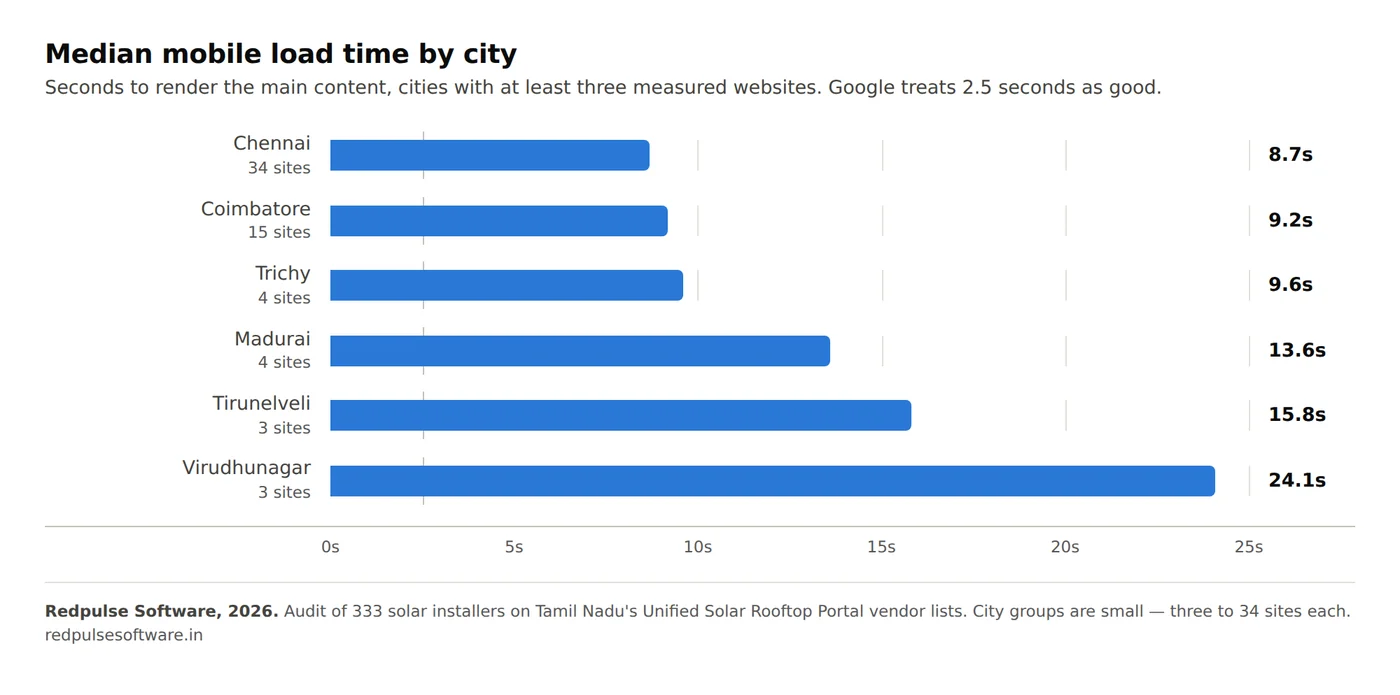
| City | Sites measured | Median LCP | Median performance score |
|---|---|---|---|
| Chennai | 34 | 8.7s | 60 |
| Coimbatore | 15 | 9.2s | 55 |
| Trichy | 4 | 9.6s | 61 |
| Madurai | 4 | 13.6s | 56 |
| Tirunelveli | 3 | 15.8s | 70 |
| Virudhunagar | 3 | 24.1s | 62 |
Finding 4: nowhere to make contact
A solar enquiry is a high-intent action: nobody browses rooftop installers casually. Our audit checked all 88 live sites for the three ways an Indian customer normally makes contact, and found:
- 43% have no contact form (38 of 88 sites)
- 48% have no
tel:link a phone user can tap to call (42 of 88) - 72% have no WhatsApp link (63 of 88), in a market where WhatsApp is the default business channel
- 20% have none of the three (18 of 88)
So one vendor in five with a working website gives a ready-to-buy visitor no one-tap way to reach them at all. The visitor has to copy a phone number by hand, or leave. The WhatsApp gap is the one that surprises: India is among the heaviest WhatsApp-business markets in the world, yet 72% of these homepages carry no click-to-chat link. These counts read the homepage only, so a form buried on an interior page would not be counted.
Finding 5: basic SEO is missing
Our audit of the 88 live sites found that 39% have no meta description, 32% have no H1 heading and 3% have no title tag at all. Five percent have a TLS problem: four serve no HTTPS at all, and three of those four also fail a certificate check, so a browser warns visitors before they can see the page. Forty percent run WordPress.
On mobile usability we can report only one measurement. Lighthouse 13 no longer returns the viewport or legible-font-size audits, so we have no data on those. The audit it does return, tap-target sizing, was failed by 18 of the 86 sites (21%): buttons and links too small or too close together to hit reliably with a thumb.
What this means
For households: the vendor lists are lists of approved installers, not of installers you can research online. Expect to phone, and expect the national portal's vendor ratings to be more use than a web search.
For vendors: the competitive bar here is remarkably low. Only two of the 86 sites we measured load in under 2.5 seconds. A site that loads in three seconds with a working enquiry form and a WhatsApp button would outperform almost every competitor on the same government list. Not because that is a high standard: because almost nobody is meeting it.
"If I ran one of these companies, I wouldn't redesign anything. I'd put a WhatsApp button and a working phone link on the page I already have, and I'd compress the photographs. That's an afternoon of work."
Ashok Kumar, founder of Redpulse Software
For the scheme: PM Surya Ghar has reached about 39.4 lakh installations and 14.07 GW, benefiting roughly 47.6 lakh households as of 20 July 2026, against a target of one crore households by March 2027 and an outlay of ₹75,021 crore. Tamil Nadu has only recently crossed one lakh installations, well behind Gujarat's 7.5 lakh, according to the same Lok Sabha reply. Its vendor layer is a network of small businesses, 53% of which are effectively invisible at the moment a subsidised customer is choosing whom to trust.
Cite this study
This data is free to cite and quote. The headline figures are: all 333 solar installers on Tamil Nadu's published vendor lists audited; 53% have no findable website; 21% of those who own a domain have let it go dead or park; 66% use a free email address as their official contact; median mobile load time 10.6 seconds across 86 measured sites, with 98% over Google's 2.5-second mark and 52% over ten seconds; 20% of live sites offer no contact form, no click-to-call link and no WhatsApp link. Collected 29 July 2026, re-verified and corrected 1 August 2026.
Use these charts
All three charts are free to republish, in print or online, with attribution to Redpulse Software and a link to this page. To embed one, copy the snippet below and change the file name to solar-study-lcp-distribution.webp, solar-study-city-load-times.webp or solar-study-email-split.webp:
<figure>
  <img src="https://redpulsesoftware.in/images/blog/solar-study-lcp-distribution.webp"
       alt="Mobile load times of 86 solar installer websites in Tamil Nadu" width="1000" />
  <figcaption>Chart: <a href="https://redpulsesoftware.in/blog/tamil-nadu-solar-vendor-website-study-2026">Redpulse Software</a></figcaption>
</figure>
Suggested citation:
Redpulse Software (2026). The State of Solar Vendor Websites in Tamil Nadu: an audit of 333 installers listed on the state's Unified Solar Rooftop Portal. Retrieved from https://redpulsesoftware.in/blog/tamil-nadu-solar-vendor-website-study-2026
We can provide city-wise or metric-specific breakdowns on request. Email contact@redpulsesoftware.in and we will send the cut you need, including the per-city medians for Chennai, Coimbatore, Trichy, Madurai, Tirunelveli and Virudhunagar. We do not release per-vendor results: the study reports aggregates only.
Method notes for anyone reproducing this
How we built the sample
Our sample is every vendor named in the two vendor-list PDFs published at tnebltd.gov.in/usrp/: a 316-name MNRE national-portal list for Tamil Nadu dated 18 April 2024, and a 44-name TNEB empanelment created 28 October 2022. That is 360 records in total. We deduplicated on email address first and business domain second, because the same company appears under different name renderings across the two documents, which removed 27 duplicates and left n=333 unique vendors. We took both lists in full rather than sampling from them, so no selection judgement of ours affects who was audited. One vendor lists no email address at all and one is headquartered outside Tamil Nadu; both remain in the sample because both appear on the published lists.
How we measured
Website discovery covered both groups in full. For the 113 vendors with a business-domain email (112 unique domains) we requested that domain directly; a response outside the 200-range, a parking page, a hosting default page or an effectively empty body counts as no website. For all 219 vendors listing only a free email address we ran an individual search on company name plus city, matched results against distinctive name and email tokens while excluding directories and marketplaces, and then fetched each candidate to confirm it was live rather than parked. Because both groups were censused, the 53% figure has no sampling error.
Speed came from the Google PageSpeed Insights API, mobile strategy, Lighthouse 13.4.1, which applies simulated throttling of roughly 1.6 Mbps down, 150 ms latency and a 4× CPU slowdown while emulating a Moto G Power (2022). Markup and TLS checks used ordinary HTTPS requests for each vendor's homepage; we did not execute JavaScript, crawl interior pages, scan for vulnerabilities or attempt any login. Contact-path figures should therefore be read as a floor. Collection ran 29 July 2026 and the full pipeline was re-run and corrected on 1 August 2026. We publish aggregate results only: no individual vendor is named as failing any check, and we do not share per-vendor data.
Corrections
This study was first published on 1 August 2026 and corrected the same day after an internal audit of the collection scripts. Four defects were found and fixed, and the whole pipeline was re-run:
- Domains answering with a 404, a 403 or a parking page were being counted as live websites. They are now counted as no website, which moved the live share from 92% to 79% and the dead-or-parked share from 8% to 21%.
- Page HTML was being truncated at 400,000 characters, so contact links further down long pages were missed. The limit is gone; "none of the three contact methods" fell from 34% to 20%.
- The free-email group was assessed from a 60-vendor sample that did not span the whole list. All 219 are now searched individually, so the headline is an exact count rather than a range.
- A parser fault dropped two vendors and mangled several names, and an earlier version of this page claimed that every site passed Lighthouse's viewport and legible-font-size audits. Lighthouse 13 does not return those audits at all; that sentence has been removed and replaced with the tap-target result, which is the only mobile-usability audit actually measured.
The direction of the correction is worth stating plainly: most of the revised figures make these vendors look better than the first version did, not worse.
A second audit on 2 August 2026 tested the discovery method itself rather than the collection scripts. Search can only find a site that ranks, so for every vendor recorded as having no findable website we also tried the domains their email address and company name imply, and checked whether the page was live and provably theirs. At least 12 of the 176 own a working site that search never surfaced. The headline is unchanged, because 53% was always the share with no findable website and that is what the census measured. What changed is the wording elsewhere: the summary, the meta description and the FAQ previously said “no website”, which was too strong. The share of these vendors with no website at all is at most 49%.
If you run rooftop solar installations and want to know how your own site scored on these checks, our free website audit tool runs the same speed and SEO checks, and the Google Business Profile audit covers the local-search side. For the fixes themselves, most of what this study measured falls under ordinary website development and maintenance work: compressing images, adding a tappable phone link, and keeping a domain pointed at something.
Need Help With Your Project?
Tell us what you're building — we'll send a detailed proposal with timeline and cost breakdown within 24 hours.
Frequently Asked Questions
How many solar vendors were audited in this study?
What percentage of Tamil Nadu solar installers have no findable website?
How slow are Indian solar installer websites on mobile?
How was the website speed measured?
Can this data be cited or reproduced?
Are individual solar vendors named in the study?
Sources & References
- CEEW — What Shapes Rooftop Solar Decisions in Indian Households (June 2026)
- TNPDCL Unified Solar Rooftop Portal — empanelled vendor list (PDF)
- TNPDCL Unified Solar Rooftop Portal — empanelled vendors (PDF)
- PIB — PM Surya Ghar Muft Bijli Yojana scheme outlay, target and subsidy structure
- PM Surya Ghar installation figures as of 20 July 2026 (Lok Sabha written reply, MoS New & Renewable Energy)
- TNPDCL — restructuring of TANGEDCO and formation of TNGECL
- Web.dev — Largest Contentful Paint thresholds
- Lighthouse — network throttling and mobile emulation settings
- W3Techs — WhatsApp usage as a website social widget
About the author
Ashok Kumar co-founded Redpulse Software in Karur, Tamil Nadu in 2010 with a single conviction: enterprise-grade software should not be a metro-only privilege. Sixteen years and 200+ projects later, that founding bet has held. Redpulse delivers the same engineering quality used by Bangalore and Chennai agencies, at Tier-2 operating cost, for businesses across India.
Ashok leads the company's business strategy, client relationships, and project management practice. He is hands-on across engagements. From the first 30-minute discovery call through the final launch readiness review, he is on every weekly client call. His technical depth is in digital marketing strategy and search optimisation. It also covers the operational discipline of running multi-channel growth programmes for Indian SMEs.
The clients Ashok has worked with span textile exporters in the Coimbatore-Tirupur belt and hospital networks across Tamil Nadu. The list also includes SaaS startups in Chennai's Tidel Park, retail chains, education institutions, and family-business manufacturers in Karur, Erode, and Salem. The pattern across all of them is the same. These are businesses that needed a real digital partner to take them from Excel-and-WhatsApp operations to digitally-instrumented growth. Not a freelancer, not a metro agency carrying metro overhead.
Outside the company, Ashok writes regularly on the Redpulse blog about practical digital marketing for Indian SMEs. His focus is transparent pricing, attribution measurement, and what actually works for businesses operating outside the venture-funded startup bubble.
Free Consultation
Get expert advice for your project